Technical Analysis: Unveiling Market Trends and Patterns – Technical analysis stands as a pivotal tool in the world of trading, providing insights into market trends, price movements, and potential opportunities. It involves analyzing historical market data, primarily price and volume, to forecast future price movements. In this article, we’ll delve into the realm of technical analysis, exploring its significance, methods, tools, and practical applications.
Introduction to Technical Analysis
At its core, technical analysis revolves around the belief that historical price movements can predict future price directions. Unlike fundamental analysis, which focuses on examining a company’s financial health and economic factors, technical analysis solely concentrates on price and volume data.
Understanding Technical Analysis Tools
Candlestick Patterns
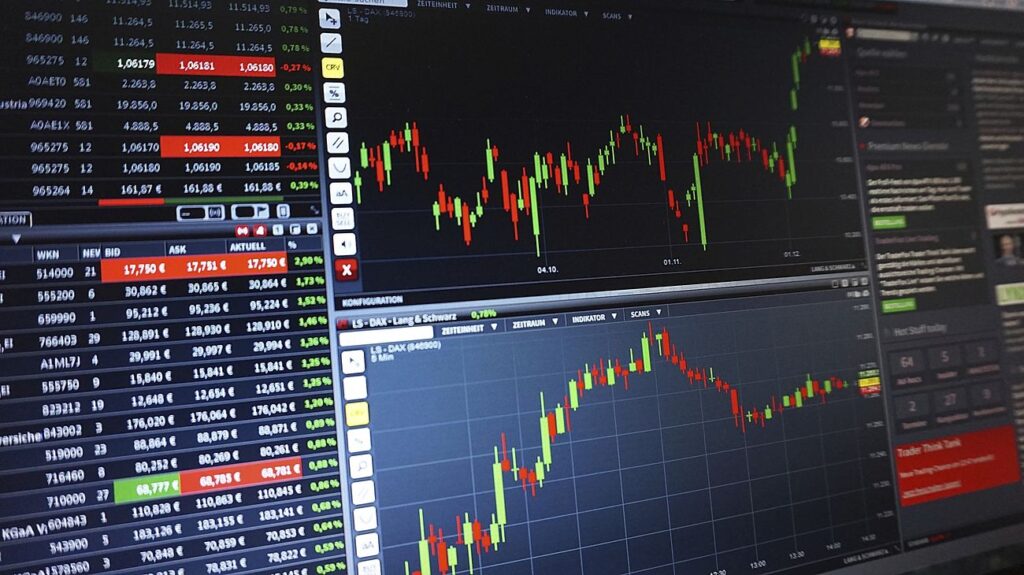
Candlestick patterns depict price movements over a specific period, offering valuable insights into market sentiment. Patterns like doji, hammer, and engulfing patterns signify potential reversals or continuations in price trends.
Support and Resistance Levels
Support and resistance levels are key zones on a price chart where the price tends to stall or reverse. Identifying these levels aids in making informed trading decisions and setting profit targets or stop-loss orders.
Moving Averages
Moving averages smooth out price data, providing a clear visual representation of the underlying trend. Traders often use moving averages to identify trend direction and potential entry or exit points.
Importance of Technical Analysis in Trading
Technical analysis serves as a vital tool for traders and investors alike, offering valuable insights into market dynamics and helping in decision-making processes. By analyzing price patterns and trends, traders can anticipate potential price movements and adjust their strategies accordingly.
Key Principles of Technical Analysis
Trend Analysis
Identifying the prevailing trend is fundamental in technical analysis. Trends can be categorized as uptrends, downtrends, or sideways trends, and understanding the trend’s direction is crucial for successful trading.
Chart Patterns
Chart patterns, such as triangles, flags, and head and shoulders patterns, provide visual cues about potential market reversals or continuations. Recognizing these patterns can help traders anticipate future price movements.
Momentum
Momentum indicators, like the Relative Strength Index (RSI) and Moving Average Convergence Divergence (MACD), measure the speed and strength of price movements. High momentum often indicates a strong trend, while divergences may signal potential reversals.
Common Technical Indicators
Technical analysts use a plethora of indicators to gauge market sentiment and identify trading opportunities. Some widely used indicators include:
- Relative Strength Index (RSI)
- Moving Average Convergence Divergence (MACD)
- Bollinger Bands
How to Perform Technical Analysis
Conducting technical analysis involves several steps, including:
- Identifying Trends: Determine the prevailing trend using trendlines or moving averages.
- Analyzing Patterns: Recognize chart patterns and formations that indicate potential price movements.
- Using Indicators: Utilize technical indicators to confirm trend signals or identify overbought/oversold conditions.
Limitations of Technical Analysis
While technical analysis provides valuable insights, it’s not without limitations. Factors like unexpected news events, market manipulation, and sudden shifts in sentiment can render technical signals ineffective.
Combining Technical and Fundamental Analysis
Many traders opt to combine technical and fundamental analysis to gain a comprehensive understanding of market dynamics. By integrating both approaches, traders can make more informed decisions and mitigate risks effectively.
Case Studies: Applying Technical Analysis
Real-life examples demonstrate the practical application of technical analysis in different market scenarios, showcasing how traders utilize various tools and techniques to analyze and interpret price movements.
The Role of Psychology in Technical Analysis
Psychological factors play a significant role in market movements. Understanding investor sentiment, fear, and greed can help traders interpret price actions more accurately and make better trading decisions.
Technical Analysis in Different Markets
Technical analysis can be applied to various financial markets, including stocks, forex, commodities, and cryptocurrencies. Each market exhibits unique characteristics, but the principles of technical analysis remain universally applicable.
Tools and Resources for Technical Analysis
Numerous software platforms and online resources provide traders with access to advanced technical analysis tools, charting capabilities, and educational materials to enhance their analytical skills.
Tips for Effective Technical Analysis
- Stay Consistent: Develop a systematic approach to technical analysis and stick to it.
- Keep Learning: Continuously educate yourself on new indicators, patterns, and strategies.
- Practice Patience: Mastering technical analysis takes time and experience; don’t expect instant results.
Conclusion
In conclusion, technical analysis serves as an indispensable tool for traders, offering valuable insights into market trends, patterns, and potential trading opportunities. By mastering the principles of technical analysis and utilizing various tools effectively, traders can enhance their decision-making processes and achieve greater success in the financial markets.
FAQs
- Is technical analysis suitable for all traders?
- Technical analysis can benefit traders of all levels, from beginners to seasoned professionals. However, it’s essential to combine technical analysis with proper risk management and market awareness.
- Can technical analysis predict future price movements accurately?
- While technical analysis provides insights into potential price directions, it’s not foolproof. External factors and unexpected events can influence market dynamics, making accurate predictions challenging.
- How can I learn technical analysis?
- There are numerous resources available, including books, online courses, and tutorials, to help you learn technical analysis. Practice analyzing charts and experimenting with different indicators to improve your skills.
- Which markets are best suited for technical analysis?
- Technical analysis can be applied to various markets, including stocks, forex, commodities, and cryptocurrencies. Each market has its unique characteristics, but the principles of technical analysis remain universally applicable.
- What role does emotion play in technical analysis?
- Emotions, such as fear, greed, and overconfidence, can cloud judgment and lead to irrational trading decisions. It’s essential for traders to manage their emotions effectively and maintain discipline while conducting technical analysis.